

The Weekly Wealth Watch
October 26, 2026
The Markets
“Successful investing is not about predicting every market move; it is about finding opportunities where the potential reward meaningfully outweighs the risk.” — Hyung Lee, HBK Capital Management.
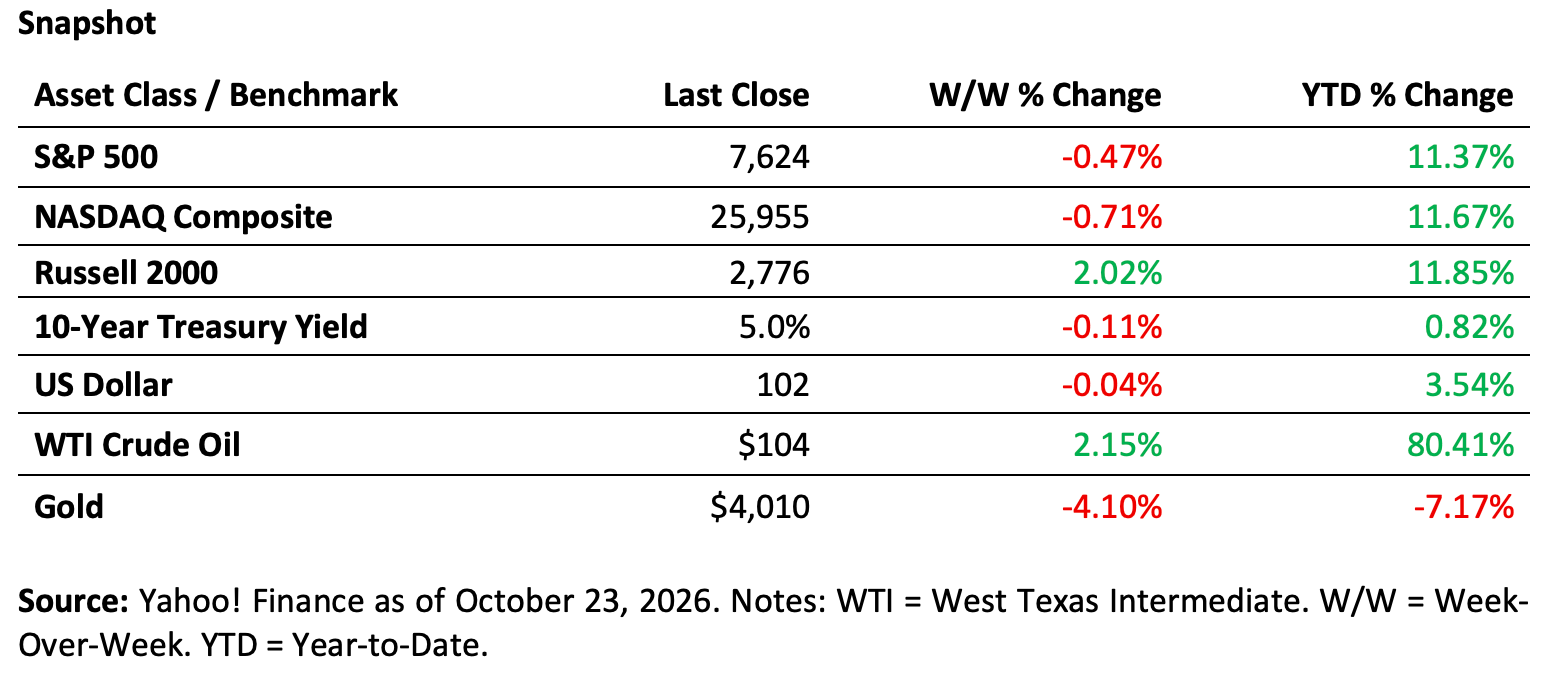
U.S. equities were mixed for the week. The S&P 500 declined 0.47%, finishing at 7,624, while the NASDAQ Composite declined 0.71% to 25,955. Small caps moved higher, with the Russell 2000 gaining 2.02% to finish at 2,776.
The 10-Year Treasury yield declined 0.11%, finishing the week at 5.0%. The U.S. Dollar declined 0.04% to 102 and remains up 3.54% year-to-date.
Commodities moved in opposite directions. WTI crude oil gained 2.15%, finishing at $104 per barrel and extending its year-to-date gain to 80.41%. Gold declined 4.10%, finishing at $4,010, bringing its year-to-date return to a decline of 7.17%.
Overall, the week showed notable divergence: large-cap equities moved modestly lower while small caps advanced, Treasury yields edged lower, oil strengthened, and gold declined sharply.
This week’s featured investor, Hyung Lee of HBK Capital Management, reinforces an important investment principle: opportunities should be considered alongside the risks required to pursue them. Disciplined investing is not about predicting every market move, but about balancing opportunity, risk, and portfolio construction.
Why Top-Down Can Work With Bottom-Up
“Know what you own, and know why you own it.”— Peter Lynch
Some investors start at the bottom, studying individual companies—their financial statements, valuations, earnings, and price trends.
Others start at the top, looking at sectors, regions, investment styles, factors, and broader market trends.
Both approaches can work.
But the Weekly Input asks a simple question:
Why choose only one?
Top-down investing can help identify larger market trends. Bottom-up investing can help determine exactly what we own within those trends.
Combining the two can provide a more complete picture.
The View From 30,000 Feet
Top-down investing starts with the landscape.
Is growth outperforming value? Is a sector breaking out? Are emerging markets gaining strength?
If a basket of biotechnology or large-growth companies is moving higher alongside strong revenue growth and profit margins, the market may be telling us something worth noticing.
But there’s a catch.
Knowing the neighborhood isn’t the same as knowing who lives in every house.
That’s where bottom-up analysis becomes valuable.
Look Under the Hood
A sector, factor, or regional fund may sound diversified, but sometimes a handful of companies can dominate exposure.
The Weekly Input provides three striking examples using Bloomberg data as of October 21:
🌏 Emerging Markets: Taiwan Semiconductor, Samsung, and SK Hynix represent just under 25% of the MSCI Emerging Markets Index and IEMG.
📊 Value: Micron represents just under 21% of the MSCI USA Value Factor Index and VLUE.
🛍️ Consumer Discretionary: Amazon and Tesla together represent more than 41% of the S&P 500 Consumer Discretionary Sector and XLY.
The lesson?
The label on the package doesn’t always tell you what’s inside.
An investor may intentionally buy exposure to a sector, region, or investment factor without realizing how much of that exposure depends on only a few companies.
Top-down helps answer:
Where do we want to invest?
Bottom-up helps answer:
What exactly do we want to own when we get there?
One provides direction. The other provides precision.
Neither eliminates risk. But together, they can provide a broader perspective.
The Best of Both Worlds?
Combining the two approaches can give a portfolio manager more flexibility.
Top-down analysis can identify broader trends across sectors, styles, factors, and regions. Bottom-up research can examine the individual companies underneath those exposures and help manage concentration and diversification.
It can also uncover opportunities that may receive little or no exposure in a particular index or fund.
Fundamental analysis tells us something about a company.
Technical analysis tells us something about the trend.
Macroeconomic analysis tells us something about the environment surrounding both.
No single lens sees everything.
Sometimes the clearer picture comes from changing lenses.
Human Interest: GPS and the Windshield
Imagine taking a road trip using only GPS.
The map tells you where you’re going—but if you never look through the windshield, you could miss what’s directly in front of you.
Now reverse it.
Drive without ever checking the map. You can see the road perfectly, but you may not know whether you’re heading toward your destination.
Investing can work similarly.
Top-down is the map. Bottom-up is the windshield.
One provides direction.
The other helps you see what you actually own along the way.
You probably want both
Fun Facts & Figures
🔎 Bottom-Up: Starts with individual securities and company-specific information.
🌎 Top-Down: Starts with broader economic or market conditions and looks across sectors, regions, styles, and factors.
📊 Nearly 25%: Three companies represent just under one-quarter of the MSCI Emerging Markets Index and IEMG, according to the Weekly Input's Bloomberg data.
🛍️ More Than 41%: Amazon and Tesla together represent more than 41% of the S&P 500 Consumer Discretionary Sector and XLY.
🎯 Tracking Error: Measures the variability of a portfolio’s returns relative to its benchmark.
Bottom Line
Top-down investing helps us see the forest.
Bottom-up investing helps us examine the trees.
Focus only on the forest, and we may overlook concentrations hiding underneath. Focus only on individual trees, and we may miss where the broader forest is heading.
Why not look at both?
The objective isn’t to find one perfect investment philosophy. It’s to use multiple perspectives to better understand what we own, why we own it, and how it fits together.
On This Day in History — October 26
🚢 1825 —the Hudson River and transforming American commerce. The Erie Canal Opens: The Erie Canal officially opened, connecting the Great Lakes with the Atlantic through
There’s a fitting connection to this week’s theme:
The canal didn’t replace the regions it connected. It made them more useful by connecting them.
🤠 1881 — The O.K. Corral: The famous shootout occurred in Tombstone, Arizona, becoming one of the best-known confrontations of the American Old West.
Two very different October 26ths:
One connected markets. The other settled a disagreement considerably less diplomatically.
Sources & Footnotes:
- Weekly Input — “Why Top-Down Can Work With Bottom-Up.” Primary source for top-down/bottom-up investing, fundamentals, technicals, macro analysis, tracking error, and concentration risk.
- Bloomberg via Weekly Input. IEMG/MSCI Emerging Markets, VLUE/MSCI USA Value Factor, and XLY/S&P 500 Consumer Discretionary holdings data are attributed to Bloomberg as of October 21, 2026.
- Weekly Input — Definitions. Investment terminology and definitions follow the Weekly Input.
- Historical References. Erie Canal opening (1825) and O.K. Corral (1881), October 26.
- Disclosure. All investing involves risk, including possible loss of principal. No investment approach, analytical method, diversification technique, or risk-management strategy can guarantee outperformance or protection from loss. Past performance does not guarantee future results.
Disclosures:
- Securities offered through LPL Financial, Member FINRA/SIPC. Investment Advice offered through WCG Wealth Advisors, LLC, a Registered Investment Advisor. WCG Wealth Advisors, LLC is a separate entity from LPL Financial.
- Bond yields are subject to change. Certain call or special redemption features may exist which could impact yield. (118-LPL)
- The S&P 500 is a stock market index tracking the stock performance of 500 of the largest companies listed on stock exchanges in the United States. Indexes are unmanaged and cannot be invested in directly. (102-LPL)
- The NASDAQ Composite Index measures all NASDAQ domestic and non-U.S. based common stocks listed on The NASDAQ Stock Market. The market value, the last sale price multiplied by total shares outstanding, is calculated throughout the trading day, and is related to the total value of the Index. Indexes are unmanaged and cannot be invested in directly. (112-LPL)
- The fast price swings in commodities will result in significant volatility in an investor’s holdings. Commodities include increased risks, such as political, economic, and currency instability, and may not be suitable for all investors. (122-LPL)
- There is no guarantee that a diversified portfolio will enhance overall returns or outperform a non-diversified portfolio. Diversification does not protect against market risk. (26-LPL)
The Russell 2000 Index is generally representative of the 2,000 smallest companies by market capitalization in the Russell 3000 index, which represents approximately 10% of the total market capitalization of the Russell 3000 Index. Indexes are unmanaged and cannot be invested in directly. Bonds are subject to market and interest rate risk if sold prior to maturity. Bond values will decline as interest rates rise. Bonds are subject to availability, change in price, call features and credit risk. The fast price swings in commodities will result in significant volatility in an investor’s holdings. Commodities include increased risks, such as political, economic, and currency instability, and may not be suitable for all investors.
Securities offered through LPL Financial, Member FINRA/SIPC. Investment Advice offered through WCG Wealth Advisors, LLC, a Registered Investment Advisor. WCG Wealth Advisors, LLC is a separate entity from LPL Financial.