

Market Strategy
by Talley Leger, Chief Market Strategist
October 30, 2026
Bull in a China Shop
Despite an uneventful Federal Open Market Committee (FOMC) meeting, many investors remain fixated on rearview-mirror inflation narratives. Judging by Lisa Cook’s and Beth Hammack’s dissents, as well as the Federal Reserve’s (Fed’s) own near-term inflation projections, a significant cohort continues to see “stick-price” inflation as a problem requiring monetary restraint.
However, Robert Hall’s and Michael Woodford’s Nobel prize-winning micro-to-macroeconomic frameworks, alongside my empirical work on economy-wide capacity utilization (capu) and output gap momentum*, paint a different picture: Core inflation momentum is right where it should be. Given the relative balance between “actual” and “potential” economic activity as well as core inflation responding predictably to the change in the output gap (see the chart below), further monetary tightening is not only unnecessary – It threatens to break lower-quality pockets of the credit and equity markets.
Core Inflation Momentum Is Right Where It Should Be Relative to Changes in the Output Gap
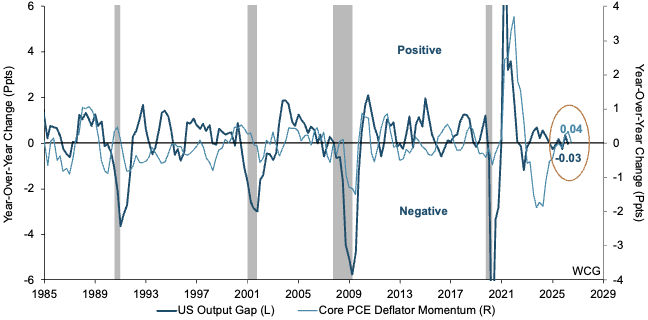
Sources: CBO, FRED, WCG, 10/27/26. Notes: Vertical gray bands = US economic recessions. CBO = Congressional Budget Office. PCE = Personal Consumption Expenditure. Ppts = Percentage points.
1. Woodford’s Framework: Output Gaps & Supply Shocks
Michael Woodford’s foundational insights and Nobel prize-winning contributions to monetary theory provide a simple, yet useful framework for informing and evaluating policy decisions:
“The second factor that governs inflation is the output gap, a concept Woodford introduced to describe the demand pressure in the economy. If the demand pressure is high, which means the gap is positive … prices are pushed upwards. If the demand pressure is too low, which means the gap is negative … prices are pushed downwards.”**
Moreover, Woodford frames how modern central banks should respond to supply shocks, such as rapid energy price spikes or geopolitical disruptions:
- When a negative supply shock reduces “natural” output – or sustainable productive capacity – more than “actual” output, a positive output gap opens without excess demand.
- Unlike outdated 1970s Keynesian models that misdiagnosed supply-side shocks as purely demand-driven overheating, Woodford’s framework highlights that modern stabilization policy must distinguish between “endogenous” or internal demand pressure and “exogenous” or external supply disruptions.
“Not-So-Sticky” Inflation: By Definition, the “Flexible-Price” CPI Could Change Quickly
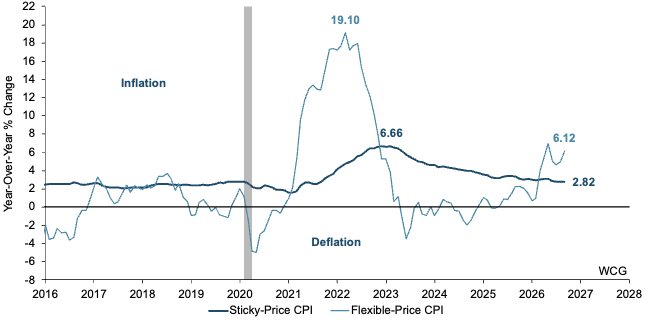
Sources: FRED, FRBA, WCG, 10/27/26. Notes: FRBA = Federal Reserve Bank of Atlanta. CPI = Consumer Price Index.
2. Empirical Reality: Core Inflation Momentum vs. Output Gap Changes
From my lens, post-1985 economic data reveal that static output gap levels show no correlation to core inflation over time. Rather, the change (Δ) in the output gap influences core inflation momentum (see the chart on page one).
- Balanced Capacity: In my view, economy-wide capu momentum sits in neutral territory, signaling that overall industrial and labor resource take-up is roughly balanced. In other words, demand-pull inflationary pressures seem subdued or even non-existent.
- Predictable Trajectory: Core personal consumption expenditure (PCE) inflation momentum tracks changes in the output gap, suggesting that underlying inflation trends generally behave as economic theory predicts.
- “Flexible-Price” Downside Surprise: Headline inflation noise has been driven largely by “exogenous” supply shocks, namely war-related energy pressures. However, “flexible-price” components (6.12%) are far more volatile than their relatively restrained “sticky-price” counterparts (2.82%). Should geopolitical tensions in the Middle East ease and the Iran conflict resolve, “flexible-price” inflation could surprise significantly to the downside (see the chart above).
3. Investment & Asset Allocation Implications: Do No Harm, Fed!
If the Fed over-emphasizes headline inflation noise and keeps hiking amidst normalizing core inflation dynamics, it risks making a policy error that could damage fragile areas of the credit and equity markets, as well as the economy. Indeed, signs of stress have already emerged in September and October.
- Government Bonds: 10-year Treasury yields responded, albeit temporarily, to cooling inflation momentum. Stable core inflation, better valuation, the highest yields in 20 years, lopsided short futures positioning and record retail flows make a bullish case for bonds.
A Bond Market Rally Could Relieve Inflation- and Rate-Sensitive Consumer Stocks
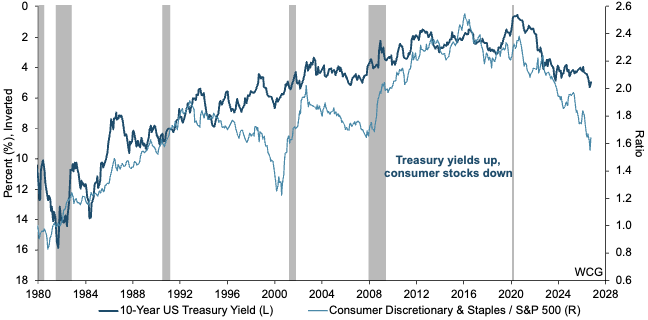
Sources: FRED, S&P Global, WCG, 10/27/26. Notes: Indices are unmanaged and an investment cannot be made directly into an index. Past performance is no guarantee of future results.
- Consumer Stocks: Runaway inflation fears and Fed rate hikes have placed acute pressure on consumer-related stocks. Peace in the Middle East, de-escalating “flexible-price” inflation and a bond market rally could boost consumer purchasing power, thereby releasing a much-needed “safety valve” for the Consumer Discretionary and Consumer Staples sectors (see the chart above).
*Market Strategy Flash, Signal vs. Noise: Cool “Core” CPI, Hot “Headline” CPI, June 12, 2026.
**The Royal Swedish Academy of Sciences, Microfoundations deliver macro insights, October 12, 2026.
Portfolio Strategy
by Jim Worden, CFA®, CMT®, CAIA®, Chief Investment Officer
October 30, 2026
The Wisdom in Waiting
We live in a day when we have instant access to information regarding events, markets, entertainment, and financial news. We also have smarter, AI-enabled chatbots that can practically answer almost any question we can imagine.
On December 6, Nasdaq is expected to launch an extended 23-hour-a-day, five-days-a-week trading window. While I think there is some benefit to more information and more access, especially for investors who live in different time zones, moves like this concern me when it comes to the average investor. Sometimes when investors get too much information, it can lead to trading more frequently, which can also lead to underperformance or making decisions based more on emotions than on logic, rationale, or longer-term thinking.
It’s helpful as investors to remember that investments most often don’t move in a straight line. There are down periods, up periods, and sideways periods. If we’re lucky, there are some straight-up periods, and if we’re unlucky, there are straight-down periods. No one knows when and how each stock will perform over any period, regardless of how confident someone may sound in the media. We always emphasize diversification and risk management, so we don’t take on too much idiosyncratic risk. We sometimes have a model or a price target, and we may get some good indications of supply or demand or other macro factors as well as fundamental data. These may give us a good idea of direction and where we might think fair value is, but there’s no predicting with absolute precision. It just doesn’t happen. If someone gets both the precise level and the timing right, it’s luck.
It’s during the in-between periods when prices sometimes ebb and flow that I believe there’s wisdom in waiting. I believe this for a few reasons:
- Investments often move in cycles, sometimes a smaller cycle within a larger one. A sector, a style, or a theme might move higher before hitting resistance, then pulling back before moving higher. It’s not always predictable when and where it happens, but it does happen. An investor who sells on the pullback might get frustrated and buy back when it’s extended once again. This can lead to poor outcomes.
- The narrative in the media often is over-focused and over-extrapolated in real time. One good or bad report from one company might shake an entire industry group, sector, or style. Because markets are made up entirely of human beings who have emotions, prices often move too high or too low. If something is going up really fast, we may have the tendency to want to get in before it goes even higher. If something is going down really fast, fear might overtake us, causing us to want to get out before it gets even worse. Neither of these is optimal for long-term investors.
- We may have a financial plan that has goals that stretch out to 10 years or more. One really good day in the market or one really bad day in the market often has little impact on a 10-year investment objective. Acting day to day on something with a time horizon of 10 years or more can be counterproductive. It may be best to leave any small tactical or surgical moves to professionals who adhere to a methodical, systematic process.
One last thought on waiting that I believe is worth remembering is that waiting does not constitute inaction. Some of the best investors learn that patiently waiting can lead to opportunities for those who are prepared. Warren Buffett is a good example of patiently waiting. It doesn’t mean inaction or that we don’t pay attention to the information that’s out there. Waiting may be the best action that we take in many instances. There can be wisdom in waiting.
Definitions
NBER Recession: A significant decline in economic activity spread across the economy, lasting more than a few months, as officially designated by the National Bureau of Economic Research. It is determined by analyzing factors like gross domestic product, income and employment.
Output Gap: The difference between actual economic output (Real GDP) and potential economic output (Real Potential GDP), expressed as a percentage of potential GDP. A positive gap indicates demand pressure exceeding sustainable capacity, while a negative gap reflects economic slack.
Real Potential GDP: The Congressional Budget Office's (CBO) estimate of the maximum sustainable output an economy can produce when labor and capital resources are fully employed at high utilization rates, adjusted for inflation.
Economy-Wide Capacity Utilization (CapU) Momentum: A normalized composite indicator tracking annual changes in broad industrial capacity utilization and labor market utilization. It measures whether resource take-up across the economy is accelerating, decelerating, or sitting in neutral balance.
Sticky-Price Consumer Price Index (CPI): A measure of inflation calculating price changes for goods and services that adjust relatively slowly (such as housing, medical care, and personal services). It reflects longer-term, underlying inflation expectations.
Flexible-Price Consumer Price Index (CPI): A measure of inflation tracking items whose prices adjust frequently in response to market conditions (such as energy, food, and motor fuels). It reflects immediate, short-term supply/demand shocks and geopolitical disruptions.
Core Personal Consumption Expenditures (PCE) Deflator: The Federal Reserve's preferred measure of underlying consumer inflation, excluding volatile food and energy prices, to gauge long-run price trends across the U.S. economy.
Natural Output: The theoretical level of economic output that would prevail if market prices were perfectly flexible and aggregate demand was aligned with structural potential supply. Sudden shifts in natural output caused by external disruptions are known as supply shocks.
Artificial intelligence (AI): Computer systems designed to perform tasks such as interpreting language, recognizing patterns, and generating responses.
Nasdaq: In this article, The Nasdaq Stock Market, a U.S. securities exchange.
Diversification: Spreading investments across different holdings, industries, or asset classes to reduce concentration risk.
Risk management: Identifying, assessing, and managing investment risks.
Idiosyncratic risk: Risk specific to an individual company or investment, rather than the broader market.
Investment model: An analytical framework that uses data and assumptions to evaluate investments or guide decisions.
Price target: An estimate of an investment’s potential future price over a specified period.
Macroeconomic factors: Broad economic conditions, such as inflation, interest rates, employment, and economic growth.
Fundamental data: Information about a company’s financial condition and business, such as earnings, revenue, debt, and cash flow.
Fair value: An estimate of an investment’s worth based on an analytical approach and its underlying assumptions.
Sector, style, and theme: A sector groups businesses by economic activity; a style groups investments by characteristics such as growth or value; a theme focuses on a particular trend or development.
Resistance: A price level or range where selling pressure may slow or reverse a price increase.
Pullback: A decline from a recent price high, often within a broader upward trend.
Extended: Describes a price that has moved substantially relative to a recent trend or reference point; it does not necessarily mean a decline will follow.
Time horizon: The period over which an investor expects to hold an investment or pursue a financial goal.
Tactical or surgical moves: Targeted portfolio adjustments made in response to particular conditions, risks, or opportunities.
Disclosures
This commentary is an opinion piece provided for informational and educational purposes only. It reflects the author’s views as of October 28, 2026, which may change without notice. It is not personalized investment advice or a recommendation to buy, sell, or hold any security or adopt any investment strategy.
All investing involves risk, including the possible loss of principal. Diversification and risk management do not guarantee a profit or protect against losses. Patience and a long investment horizon do not assure favorable results; holding an investment through a decline can result in further losses. Changes in an investor’s circumstances or an investment’s fundamentals may warrant reassessment.
Models, price targets, fair-value estimates, and expectations depend on assumptions and may prove incorrect. No investment process or professional manager can guarantee results. Past performance is not indicative of future results.
Extended-hours trading may involve lower liquidity, greater volatility, wider bid-ask spreads, and prices that differ from those during regular trading hours. Exchange schedules and implementation plans may change.
The reference to Warren Buffett is illustrative only and does not imply his endorsement of the author, any firm, or any investment strategy.
The views expressed are for informational and educational purposes only and are subject to change without notice.
This material is not intended as, and should not be interpreted as, individualized investment advice or a recommendation to buy, sell, or hold any security, sector, industry, or investment strategy.
References to specific companies, securities, sectors, or industries are for illustrative purposes only and should not be construed as investment recommendations.
Investing involves risk, including the possible loss of principal. Investments in a specific industry or sector may involve greater risk and volatility than more diversified investments.
Past performance is not indicative of future results. No investment strategy can guarantee a profit or protect against loss.
Forward-looking statements, including views about future demand, pricing, supply, or industry cycles, are based on current expectations and assumptions and are subject to risks and uncertainties. Actual results may differ materially.
Data and information are believed to be reliable, but accuracy, completeness, and timeliness are not guaranteed. Source documents should be retained for factual claims, third-party research references, and company-specific data.
Portfolio holdings, allocations, and risk budgets are subject to change based on market conditions, client objectives, and investment guidelines.
The author, firm, clients, or related persons may hold positions in securities mentioned and may buy or sell those securities without notice, subject to applicable policies and regulations.
Securities offered through LPL Financial, Member FINRA/SIPC. Investment Advice offered through WCG Wealth Advisors, LLC, an SEC Registered Investment Advisor. WCG Wealth Advisors, LLC and The Wealth Consulting Group are separate entities from LPL Financial. Index performance is shown for illustrative purposes only and does not predict or depict the performance of any investment. Past performance does not guarantee future results.
All information in this report is believed to be from reliable sources; however, WCG Wealth Advisors, LLC, makes no representation as to its completeness or accuracy.
In general, stock values fluctuate, sometimes widely, in response to activities specific to the companies as well as broad market, economic and political conditions. Stock investing involves risks, including fluctuating prices and loss of principal. Value investments can perform differently from the market as a whole. They can remain undervalued by the market for long periods of time. (135-LPL) International investing involves special risks such as currency fluctuation and political instability and may not be suitable for all investors. These risks are often heightened for investments in emerging markets. (93-LPL)
The fast price swings in commodities will result in significant volatility in an investor’s holdings. Commodities include increased risks, such as political, economic, and currency instability, and may not be suitable for all investors. (122-LPL)
Rebalancing a portfolio may cause investors to incur tax liabilities and/or transaction costs and does not assure a profit or protect against a loss. (28-LPL)
There is no guarantee that a diversified portfolio will enhance overall returns or outperform a non-diversified portfolio. Diversification does not protect against market risk. (26-LPL)
Standard deviation is a historical measure of the variability of returns relative to the average annual return. If a portfolio has a high standard deviation, its returns have been volatile. A low standard deviation indicates returns have been less volatile. (131-LPL)
This is for educational / general purposes only, does not constitute investment, tax or legal advice and should not be relied on as such. This is not to be construed as an offer to buy or sell any financial instruments. Any strategies discussed are not intended to be relied upon as the sole factor in making an investment decision for any individual. As with all investments there are associated inherent risks. Please obtain and review all financial material carefully before investing. All material presented is compiled from sources believed to be reliable and current, but accuracy cannot be guaranteed. The opinions voiced in this material are for general information only and are not intended to provide specific advice or recommendations for any individual. All performance referenced is historical and is no guarantee of future results. All indices are unmanaged and may not be invested in directly. These comments should not be construed as recommendations but as an illustration of broader themes.
Forward-looking statements are not guarantees of future results. They involve risks, uncertainties and assumptions; there can be no assurance that actual results will not differ materially from expectations. In addition, forward-looking statements, including index targets or market scenarios, are hypothetical in nature, reflect current views and assumptions and are subject to change based on market and economic conditions and are not guarantees of future performance. This is a hypothetical example and is not representative of any specific investment. Your results may vary. (88-LPL) Scenario outcomes are illustrative and not predictive. This does not constitute a recommendation of any investment strategy or product for a particular investor. Investors should consult a financial professional before making any investment decisions.
The S&P 500 is a stock market index tracking the stock performance of 500 of the largest companies listed on stock exchanges in the United States. Indexes are unmanaged and cannot be invested in directly. (102-LPL)
Government bonds and Treasury bills are guaranteed by the US government as to the timely payment of principal and interest and, if held to maturity, offer a fixed rate of return and fixed principal value.
Publication Date: October 30, 2026
For Public Use in the US
The Wealth Consulting Group
LPL 1200550