

Market Strategy
by Talley Leger, Chief Market Strategist
August 14, 2026
Anatomy of a Bull Market: Why 2026 Isn’t 2022
Is the US stock market overextended and heading for a crash? No, not in my opinion. While we won’t know the precise outcome until 4:00 PM on December 31, a comparison of currently favorable and previously challenging operating conditions should ease investor anxiety in the meantime.
In 2022, the massive negative shock from runaway inflation, a hostile Federal Reserve (Fed), alarmingly restrictive financial conditions, an “everything” bear market and an S&P 500 earnings recession weren’t enough to take down the US economy.
By contrast, 2026 has provided a surprisingly friendly investment climate: Relatively cool “core” inflation, a neutral-to-supportive Fed, broadly accommodative financial conditions and booming corporate profit growth (see the table below).
6 Important Ways 2026 Differs From 2022
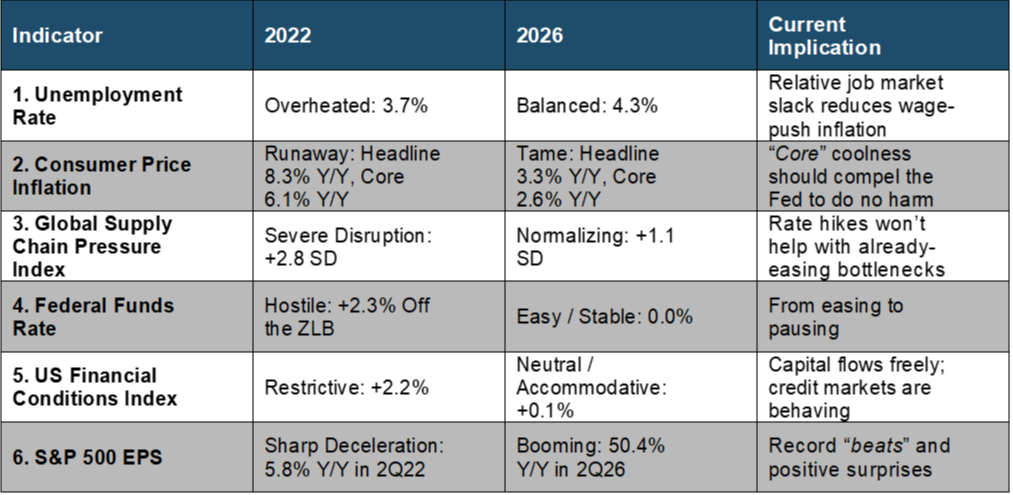
Sources: FRED, WCG, 08/12/26. Notes: Y/Y = Year over year. SD = Standard deviation. ZLB = Zero lower bound. EPS = Earnings per share.
This hospitable macro and microeconomic environment anchors my investment thesis for an ongoing economic expansion and bull market in stocks.
1. Bad Labor Market News = Good Stock Market News
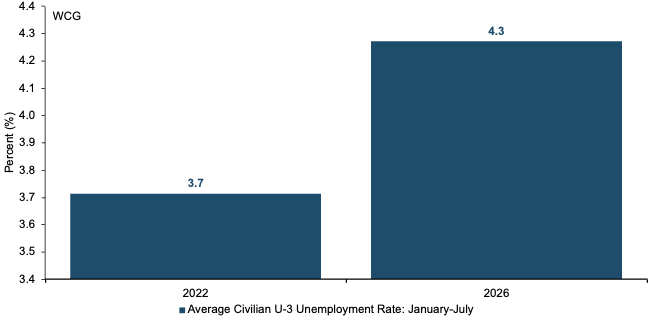
- 2022: At that time, the average U-3 civilian unemployment rate (UR) sat at an overheated 3.7%, reflecting acute labor shortages and wage-push inflation in the wake of the global pandemic and “Great Shutdown” of 2020.
- 2026: Since then, the labor market has softened to an average UR of 4.3% through July of this year. A modestly higher UR reflects better balance between labor market supply and demand, as opposed to an overheating job market (i.e., too tight) or recessionary job losses (i.e., too loose) [see the chart below].
#1: The job market’s weaker now than it was then
Sources:FRED, BLS, WCG, 08/12/26. Notes: BLS = Bureau of Labor Statistics.
2. Good Inflation News = Good Fed News
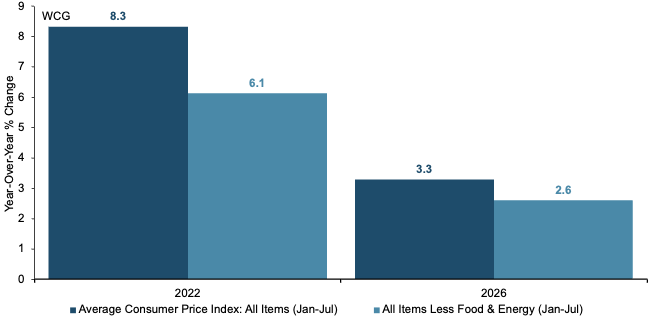
- 2022: Inflation was rampant with the January-July average Consumer Price Index (CPI) for All Items soaring to a punishing rate of 8.3% year-over-year (Y/Y) and the CPI for All Items Less Food & Energy surging 6.1% Y/Y.
- 2026: Price stability has largely been restored. Year-to-date (YTD) average “headline” CPI has cooled to 3.3% Y/Y while “core” CPI has retreated below the psychologically important 3.0% threshold to 2.6% Y/Y, giving the Fed scope to maintain policy support or at least avoid causing harm (see the chart below).
#2: Inflation is much cooler in 2026 than it was in 2022
Sources: FRED, BLS, WCG, 08/12/26.
3. Good Supply Chain News = Good Inflation News
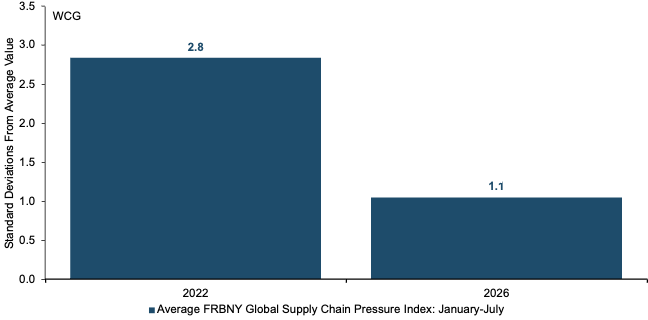
- 2022:The Federal Reserve Bank of New York’s Global Supply Chain Pressure Index (GSCPI) averaged +2.8 standard deviations above its historical average, reflecting disruption, long delivery times / delays and related cost increases across the manufacturing, wholesale and retail sectors.
- 2026: Despite intermittent shocks, supply networks have generally normalized with the GSCPI easing to +1.1 standard deviations. The unspooling of global logistical constraints continues to suppress input costs and protect operating profit margins, which is a stiff earnings tailwind (see the chart below).
#3: Supply chain disruptions are much less intense and are moving in the right direction
Sources: FRBNY, WCG, 08/12/26. Notes: FRBNY = Federal Reserve Bank of New York.
4. Good Fed News = Good Stock Market News
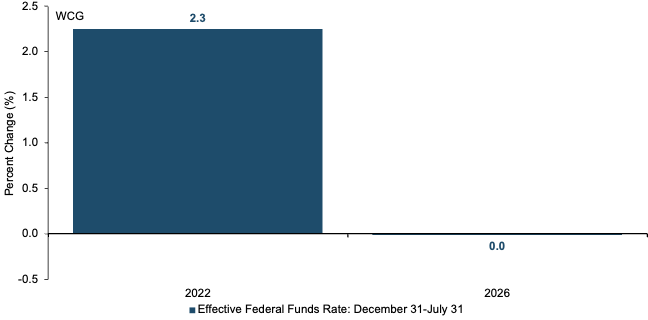
- 2022:The Fed embarked on one of the most intense / aggressive interest rate-hiking campaigns in modern history, lifting the federal funds rate (FFR) off the zero lower bound (ZLB) by 2.3 percentage points from December 31, 2021 to July 31, 2022.
- 2026: Monetary policy has shifted from restrictive to supportive. After a period of rate cuts, the FFR has remained unchanged so far this year (a 0.0% change YTD), a markedly easier policy backdrop where rates rest well below the pace of nominal economic activity (see the chart below).
#4: The policy rate hasn’t moved this year
Sources: FRED, WCG, 08/12/26.
5. Good Financial Conditions = Good Economic Conditions
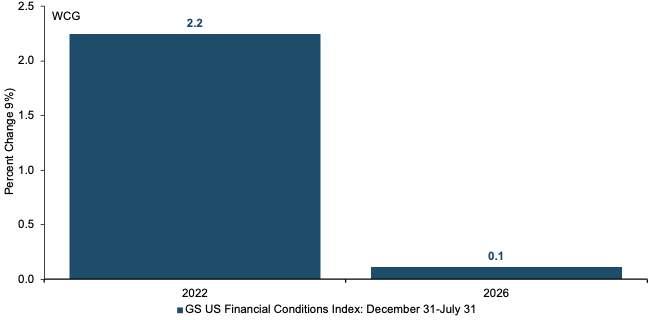
- 2022: The Goldman Sachs US Financial Conditions Index (FCI) tightened sharply by +2.2% in the first seven months of the year, choking off liquidity and crushing equities.
- 2026:Financial conditions have stayed steady and accommodative (a +0.1% change YTD). Ample liquidity and abundant credit continue to lubricate capital markets and business investment (see the chart below).
#5: Broader financial conditions are accommodative, not restrictive
Sources: GS, WCG, 08/12/26. Notes: GS = Goldman Sachs.
6. Booming Earnings = Booming Stocks
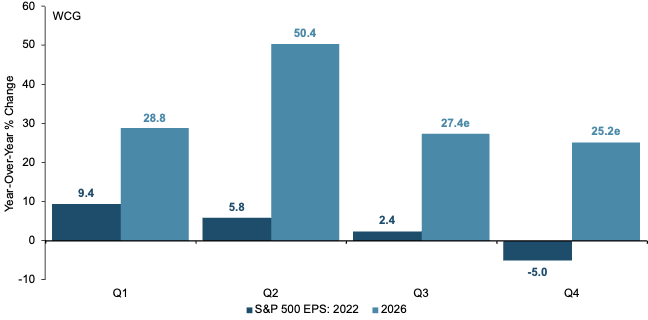
- 2022: S&P 500 earnings per share (EPS) growth witnessed a sharp deceleration, sliding from +9.4% Y/Y in 1Q22 to -5.0% in 4Q22 as margin compression took hold.
- 2026: Corporate earnings have powerfully accelerated. S&P 500 EPS surged +28.8% Y/Y in 1Q26 and +50.4% Y/Y in 2Q26, with bottom-up analysts expecting +27.4% Y/Y in 3Q26 and +25.2% Y/Y in 4Q26. It never ceases to amaze me how the strength of earnings recoveries always seems to catch investors off guard (see the chart below)!
#6: Earnings are booming, not collapsing
Sources: FactSet, WCG, 08/12/26.
Bottom Line
2022 = Inflation spiral + Fed tightening + restrictive financial conditions + supply-chain disruption + earnings deterioration
2026 = Cooler inflation + a neutral / supportive Fed + accommodative financial conditions + normalized supply chains + accelerating earnings
If the US economy was resilient enough to absorb the historic negative shocks of 2022 without falling into a deep recession, it stands to reason that the “Goldilocks” environment of 2026 – characterized by cool “core” inflation, a supportive Fed, accommodative financial conditions and persistent double-digit earnings growth – should continue providing strong tailwinds for stocks through the rest of the year.
In other words, it isn’t too late for fearful or doubtful investors to harness the raw earnings power and macro-to-micro forces behind share prices.
Portfolio Strategy
by Jim Worden, CFA®, CMT®, CAIA®, Chief Investment Officer
August 14, 2026
Supercycles
While I spend most of my time looking at individual investments, portfolio construction and management, and risk, I often like to follow the adage of “when in doubt, zoom out.” A while back I wrote about cycles, and since a certain chart is out there floating around in the social media ether, I thought another piece on cycles, namely supercycles, would be helpful.
There has been plenty written on cycles, from Ray Dalio1 on cycles related to debt, political arcs, new world orders, and productivity to Strauss and Howe2 in The Fourth Turning on generational personalities or archetypes.
There has been and there likely will continue to be much written about different types of economic, market, and demographic cycles and supercycles. Full disclosure – I am a big believer that cycles exist and that they are everywhere. But I also am skeptical about anyone or anything that supposedly can predict with any degree of precision when cycles or supercycles will start and end. The truth is, much of the data we have on cycles is after the fact, not before they start and end. Regarding supercycles – cycles that can last 10 years or more – these are not rhythmic sine waves that are predictable. Some cycles last longer than others. They are also not uniform in shape, as the image below illustrates.

(Image produced by ChatGPT)
Kondratieff3, Schumpeter4, Perez5, Benner6, and the “historians”7, who were only looking at the Industrial Revolution phase, have done extensive analysis of cycles. The historians see the Industrial Revolution as not part of a cycle but as a one-time structural transformation.
That brings us to today and what is happening with AI. As it relates to memory demand and supply, GPUs, infrastructure buildout, and consumer adoption, I wholeheartedly believe there are cycles for each of these and I believe they vary by duration. But when we zoom out and look at the larger landscape, it could be one large supercycle or it could be a very large one-time structural transformation, like what may have transpired during the Industrial Revolution. The key for all of us who are living through it now is to realize that we are not likely going to know where and how it ends until after it happens. That could be stressful to think about for some, but it could also be reassuring to others.
I remain optimistic that whatever the timeline and however it completely unfolds, we will be better off with it than without it.
Footnotes:
- Dalio, R. Principles for Dealing with the Changing World Order: Why Nations Succeed and Fail. 2021
- Strauss, W. and N. Howe. The Fourth Turning:An American Prophecy. 1997
- Kondratiev, N. D. "Die langen Wellen der Konjunktur." Archiv für Sozialwissenschaft und Sozialpolitik 56 (1926): 573–609. Abridged English translation: "The Long Waves in Economic Life," Review of Economic Statistics 17, no. 6 (1935): 105–115.
- Schumpeter, J. A. Business Cycles: A Theoretical, Historical and Statistical Analysis of the Capitalist Process. 2 vols. New York: McGraw-Hill, 1939.
- Perez, C. Technological Revolutions and Financial Capital: The Dynamics of Bubbles and Golden Ages. Cheltenham: Edward Elgar, 2002.
- Benner, S. T. Benner's Prophecies of Future Ups and Downs in Prices. Cincinnati: Robert Clarke & Co., 1875.
- The “Historians”:
- Toynbee, A. Lectures on the Industrial Revolution in England. London: Rivingtons, 1884. Delivered 1881–82; published posthumously.
- Mantoux, P. La Révolution industrielle au XVIIIᵉ siècle. Paris, 1906. English trans. The Industrial Revolution in the Eighteenth Century. London: Jonathan Cape, 1928.
- Ashton, T. S. The Industrial Revolution 1760–1830. Oxford: Oxford University Press, 1948.
- Deane, P., and W. A. Cole. British Economic Growth 1688–1959: Trends and Structure. Cambridge: Cambridge University Press, 1962.
- Hobsbawm, E. J. Industry and Empire. London: Weidenfeld & Nicolson, 1968.
- Landes, D. S. The Unbound Prometheus. Cambridge: Cambridge University Press, 1969.
- Cameron, R. "A New View of European Industrialization." Economic History Review 38, no. 1 (1985): 1–23.
- Crafts, N. F. R. British Economic Growth during the Industrial Revolution. Oxford: Clarendon Press, 1985.
- Wrigley, E. A. Continuity, Chance and Change: The Character of the Industrial Revolution in England. Cambridge: Cambridge University Press, 1988.
- Crafts, N. F. R., and C. K. Harley. "Output Growth and the British Industrial Revolution: A Restatement of the Crafts–Harley View." Economic History Review 45, no. 4 (1992): 703–730.
- Mokyr, J., ed. The British Industrial Revolution: An Economic Perspective. Boulder: Westview Press, 1993; 2nd ed. 1999.
- Allen, R. C. The British Industrial Revolution in Global Perspective. Cambridge: Cambridge University Press, 2009.
- Mokyr, J. The Enlightened Economy: An Economic History of Britain 1700–1850. New Haven: Yale University Press, 2009.
Definitions
Federal Reserve: The central banking system of the United States that manages monetary policy to promote maximum employment and stable prices. It regulates financial institutions and maintains stability in the overall financial system.
Consumer Price Index: An economic metric that measures the average change over time in the prices paid by urban consumers for a market basket of consumer goods and services. It serves as the primary tool for measuring inflation and deflation.
Global Supply Chain Pressure Index: An index created by the Federal Reserve Bank of New York that tracks global supply chain disruptions using shipping rates and manufacturing data. It helps gauge inflationary pressures stemming from logistical bottlenecks.
Standard Deviation: A statistical measurement that quantifies the amount of variation or dispersion in a set of data values. In finance, it is commonly used to measure investment volatility and risk.
Effective Federal Funds Rate: The volume-weighted median of overnight interest rates backed by transactions between depository institutions. It represents the actual rate at which banks lend to each other overnight.
Goldman Sachs US Financial Conditions Index: A weighted index that tracks stock prices, interest rates, credit spreads, and currency values to gauge the overall availability of credit in the U.S. economy. A lower index level signifies looser financial conditions that support economic growth.
S&P 500: A stock market index that tracks the performance of 500 of the largest companies listed on United States stock exchanges. It is widely regarded as the best single gauge of large-cap U.S. equities.
Earnings Per Share: A financial metric calculated by dividing a company's net profit by the number of its outstanding shares of common stock. It indicates how much money a company makes for each share of its stock.
Artificial intelligence (AI):Computer systems capable of performing tasks commonly associated with human intelligence, including learning, reasoning, pattern recognition, and content generation.
Cycle:A recurring or broadly repeating pattern in economic, market, technological, or demographic activity. The timing, duration, and shape of cycles can vary.
Supercycle:As used in this article, a long-duration cycle that can extend for 10 years or more.
Graphics processing unit (GPU):A processor designed for highly parallel computation and widely used in artificial-intelligence workloads.
Memory:In this context, semiconductor-based computer memory used to store and rapidly access data for computing workloads.
Infrastructure buildout:The expansion of physical and digital capacity, such as data centers, networking, power, cooling, and computing hardware, needed to support technology deployment.
Sine wave:A smooth, periodic mathematical wave used here only as a conceptual illustration of a repeating cycle.
Structural transformation:A long-lasting change in the structure or functioning of an economy, industry, or technology ecosystem that may not be recurring or cyclical.
Disclosures
This material is provided for informational and educational purposes only and is not intended as investment advice, a recommendation, or an offer or solicitation to buy or sell any security, investment product, or investment strategy.
The views expressed are opinions as of August 13, 2026, are based on information available at the time of writing, and are subject to change without notice. Forward-looking statements reflect current expectations and are inherently uncertain; actual outcomes may differ materially. No forecast or projection is guaranteed.
References to historical economic, market, demographic, and technological cycles are illustrative. Historical patterns may not repeat and should not be relied upon to predict the timing, duration, or outcome of future cycles, market events, or investment performance.
The image in this article was produced using ChatGPT and is a conceptual illustration only. It is not based on historical or empirical market data and is not intended to depict or forecast the timing, duration, amplitude, or sequence of any actual economic, technological, or market cycle.
Information and source materials are obtained from sources believed to be reliable; however, their accuracy, completeness, and timeliness are not guaranteed.
The views expressed are for informational and educational purposes only and are subject to change without notice.
This material is not intended as, and should not be interpreted as, individualized investment advice or a recommendation to buy, sell, or hold any security, sector, industry, or investment strategy.
References to specific companies, securities, sectors, or industries are for illustrative purposes only and should not be construed as investment recommendations.
Investing involves risk, including the possible loss of principal. Investments in a specific industry or sector may involve greater risk and volatility than more diversified investments.
Past performance is not indicative of future results. No investment strategy can guarantee a profit or protect against loss.
Forward-looking statements, including views about future demand, pricing, supply, or industry cycles, are based on current expectations and assumptions and are subject to risks and uncertainties. Actual results may differ materially.
Data and information are believed to be reliable, but accuracy, completeness, and timeliness are not guaranteed. Source documents should be retained for factual claims, third-party research references, and company-specific data.
Portfolio holdings, allocations, and risk budgets are subject to change based on market conditions, client objectives, and investment guidelines.
The author, firm, clients, or related persons may hold positions in securities mentioned and may buy or sell those securities without notice, subject to applicable policies and regulations.
Securities offered through LPL Financial, Member FINRA/SIPC. Investment Advice offered through WCG Wealth Advisors, LLC, an SEC Registered Investment Advisor. WCG Wealth Advisors, LLC and The Wealth Consulting Group are separate entities from LPL Financial. Index performance is shown for illustrative purposes only and does not predict or depict the performance of any investment. Past performance does not guarantee future results.
All information in this report is believed to be from reliable sources; however, WCG Wealth Advisors, LLC, makes no representation as to its completeness or accuracy.
In general, stock values fluctuate, sometimes widely, in response to activities specific to the companies as well as broad market, economic and political conditions. Stock investing involves risks, including fluctuating prices and loss of principal. Value investments can perform differently from the market as a whole. They can remain undervalued by the market for long periods of time. (135-LPL) International investing involves special risks such as currency fluctuation and political instability and may not be suitable for all investors. These risks are often heightened for investments in emerging markets. (93-LPL)
The fast price swings in commodities will result in significant volatility in an investor’s holdings. Commodities include increased risks, such as political, economic, and currency instability, and may not be suitable for all investors. (122-LPL)
Rebalancing a portfolio may cause investors to incur tax liabilities and/or transaction costs and does not assure a profit or protect against a loss. (28-LPL)
There is no guarantee that a diversified portfolio will enhance overall returns or outperform a non-diversified portfolio. Diversification does not protect against market risk. (26-LPL)
Standard deviation is a historical measure of the variability of returns relative to the average annual return. If a portfolio has a high standard deviation, its returns have been volatile. A low standard deviation indicates returns have been less volatile. (131-LPL)
This is for educational / general purposes only, does not constitute investment, tax or legal advice and should not be relied on as such. This is not to be construed as an offer to buy or sell any financial instruments. Any strategies discussed are not intended to be relied upon as the sole factor in making an investment decision for any individual. As with all investments there are associated inherent risks. Please obtain and review all financial material carefully before investing. All material presented is compiled from sources believed to be reliable and current, but accuracy cannot be guaranteed. The opinions voiced in this material are for general information only and are not intended to provide specific advice or recommendations for any individual. All performance referenced is historical and is no guarantee of future results. All indices are unmanaged and may not be invested in directly. These comments should not be construed as recommendations but as an illustration of broader themes.
Forward-looking statements are not guarantees of future results. They involve risks, uncertainties and assumptions; there can be no assurance that actual results will not differ materially from expectations. In addition, forward-looking statements, including index targets or market scenarios, are hypothetical in nature, reflect current views and assumptions and are subject to change based on market and economic conditions and are not guarantees of future performance. This is a hypothetical example and is not representative of any specific investment. Your results may vary. (88-LPL) Scenario outcomes are illustrative and not predictive. This does not constitute a recommendation of any investment strategy or product for a particular investor. Investors should consult a financial professional before making any investment decisions.
The S&P 500 is a stock market index tracking the stock performance of 500 of the largest companies listed on stock exchanges in the United States. Indexes are unmanaged and cannot be invested in directly. (102-LPL)
Government bonds and Treasury bills are guaranteed by the US government as to the timely payment of principal and interest and, if held to maturity, offer a fixed rate of return and fixed principal value.
Publication Date: August 14, 2026
For Public Use in the US
The Wealth Consulting Group
LPL1159838